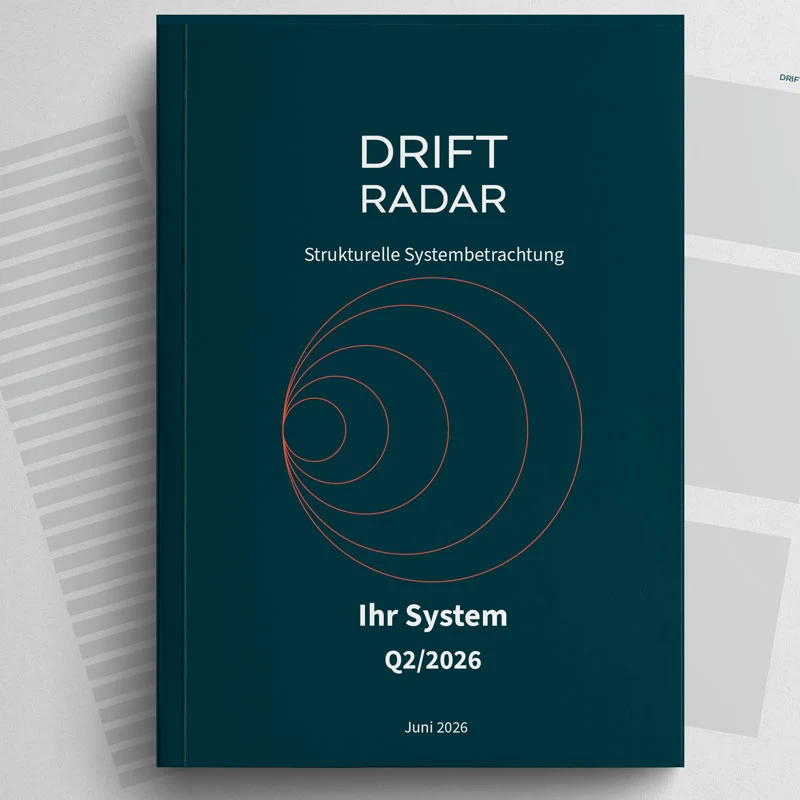
RADAR of DRIFT
Targeting system for spatial, social, and structural shifts.
The radar isn't a tool. It's a targeting method for municipal drift, bottlenecks, and tipping points. It shows where decisions succeed—and where they fail—before it happens.
What the radar does
How far can traffic shifts from the city center extend? Where are they headed? What impact do demographic change, the bypass, and the relocation of the central bus station have?
The radar of drift goes beyond mere statistics. These movements give rise to load zones of varying characteristics. Taking action within these zones themselves means combating the symptoms.
Observing these flows means actively shaping shifts in load and prioritizing measures.
The municipal drift radar identifies shifts, bottlenecks, and tipping points before they become apparent.
It identifies opportunities and highlights areas for decision-making.
It does not rely on traditional metrics, but rather on vector fields, drift lines, and bottleneck logic.
- Direction of developments
- Speed of shifts
- Intensity of forces
- Interconnections between areas
- Tipping points in a time matrix
What’s behind it?
The Drift Radar is not a control tool, but a targeting screen. It answers three specific questions:
- How does the city measure up against its own guiding principles?
- Where do drifts, bottlenecks, and tipping points arise?
- What structural impulses result from this for the actors themselves?
It provides data for locating and utilizing logical potential.
Consulting thing? Workshop? Crystal ball?
What Radar of Drift is not:
How the radar works
Local Task Force (internal)
The municipality provides a small group consisting of representatives from planning, the building department, environmental/nature conservation, transportation, real estate, and political leadership.
This group provides:
- Changes in land use and vacant properties
- Conflicts and internal tensions
- Maps, photos, observations
The task force is the radar’s resonant core.
External Drift Analysis
MOAT analyzes the structure: vector fields (direction and velocity), drift lines, dilemma fields, path architecture, and potential tipping points.
Monthly Drift Assessment
Based on a small data package from the task force, the following are generated:
- Drift Map
- Bottleneck Map
- Path Correction
Semiannual Path Correction
Every six months, drift lines, bottlenecks, tipping points, and priorities are reevaluated, and the structural paths are adjusted.
What the radar detects
- Central drift/location drift (e.g., market → train station)
- Identity leakage due to changes in use and loss of rituals
- Exacerbation of bottlenecks in traffic, topography, or politics
- Tipping points when multiple drift lines converge
- Shifts between residential, commercial, everyday life, and transportation
- Climate drift (heat, water, retention)
Das Drift‑Radar liefert Sicherheit, Klarheit, Priorisierung, Frühwarnung und eine eindeutige Richtung
für Entscheidungen.
Skalierbare Begleitung
MOAT operates not on an operational basis, but rather on a structural one. With one task force per municipality, a streamlined data stream, and a monthly drift review, MOAT can support numerous municipalities simultaneously.
Positioning
The municipal drift radar detects shifts, bottlenecks, and tipping points not based on intuition, but based on vector fields in a time matrix. The municipality provides the raw data; MOAT interprets the drift.